
Manufacturing Industry Statistics of October 2026

We compiled this report from ten public statistical publications and data series produced by four agencies: the Bureau of Economic Analysis, the Bureau of Labor Statistics, the Census Bureau, and the Federal Reserve. Several of the government series are distributed through FRED, so they aren’t independent of the agencies that produce them. We reviewed the research on October 11, 2026, using reporting periods from 2024 through September 2026. This is an original compilation of published statistics, not a new survey of manufacturers.
The latest manufacturing payroll estimate was 12,652,000 jobs in September 2026, up from 12,612,000 a year earlier. Manufacturing value added reached $3,168.1 billion at a seasonally adjusted annual rate in the second quarter of 2026. That dollar figure measures manufacturing’s contribution to the economy. It isn’t factory sales, shipment value, or the amount produced in that quarter alone.
U.S. Manufacturing Size and Economic Contribution: Latest Available Data, October 2026
You can measure manufacturing’s size through economic contribution, revenue, employment, or international trade. Each indicator describes a different part of the industry, so they shouldn’t be added together or swapped for one another.
The U.S. Manufacturing Industry Snapshot, 2026
| Metric | Reported figure | Reporting period | Definition and source |
|---|---|---|---|
| Manufacturing value added | $3,168.1 billion | Q2 2026 | Current dollars, seasonally adjusted annual rate; contribution to GDP, not revenue. BEA via FRED |
| Manufacturing share of GDP | 9.7% | Q2 2026 | Published GDP share; FRED labels this series not seasonally adjusted. BEA via FRED |
| Manufacturing payroll employment | 12,652,000 jobs | September 2026 | Seasonally adjusted; preliminary estimate. BLS |
| Manufacturing total revenue | $7.0 trillion | 2024 | Annual Integrated Economic Survey figure, rounded as published. Census Bureau |
| Manufactured commodity exports | $164.164 billion | August 2026 | Monthly, not seasonally adjusted; NAICS-based product codes 31–33, origin-of-movement basis. Census via FRED |
| Manufacturing capacity utilization | 75.7% | August 2026 | NAICS manufacturing, seasonally adjusted; preliminary estimate. Federal Reserve |
The revenue and value-added figures aren’t competing estimates of the same thing. Revenue records sales activity, and value added measures the industry’s contribution to GDP. Here they also cover different reporting periods. In the same way, August exports are one month’s trade value. They aren’t an annual total or a measure of goods produced only in August.
For manufacturing teams, supply chain planning starts with a benchmark that matches the question. Workforce planning calls for employment data. Economic scale calls for value added. Export activity calls for trade data. None of these measures, on its own, tells you how much warehouse space or transportation capacity a specific business needs.
U.S. Manufacturing Employment: May–September 2026
Manufacturing payrolls rose in every month of the five-month window below. The latest estimate was 57,000 jobs above May’s level, and the year-over-year increase from September 2025 was 40,000 jobs.
The U.S. Manufacturing Employment Trend, 2026
| Month | Manufacturing payroll jobs | Estimate status |
|---|---|---|
| May 2026 | 12,595,000 | Published historical estimate |
| June 2026 | 12,608,000 | Published historical estimate |
| July 2026 | 12,628,000 | Published historical estimate |
| August 2026 | 12,643,000 | Preliminary |
| September 2026 | 12,652,000 | Preliminary |
All figures are seasonally adjusted. FRED reports the series in thousands, and we multiplied those values by 1,000 to show payroll jobs. The August and September preliminary flags follow the BLS release.
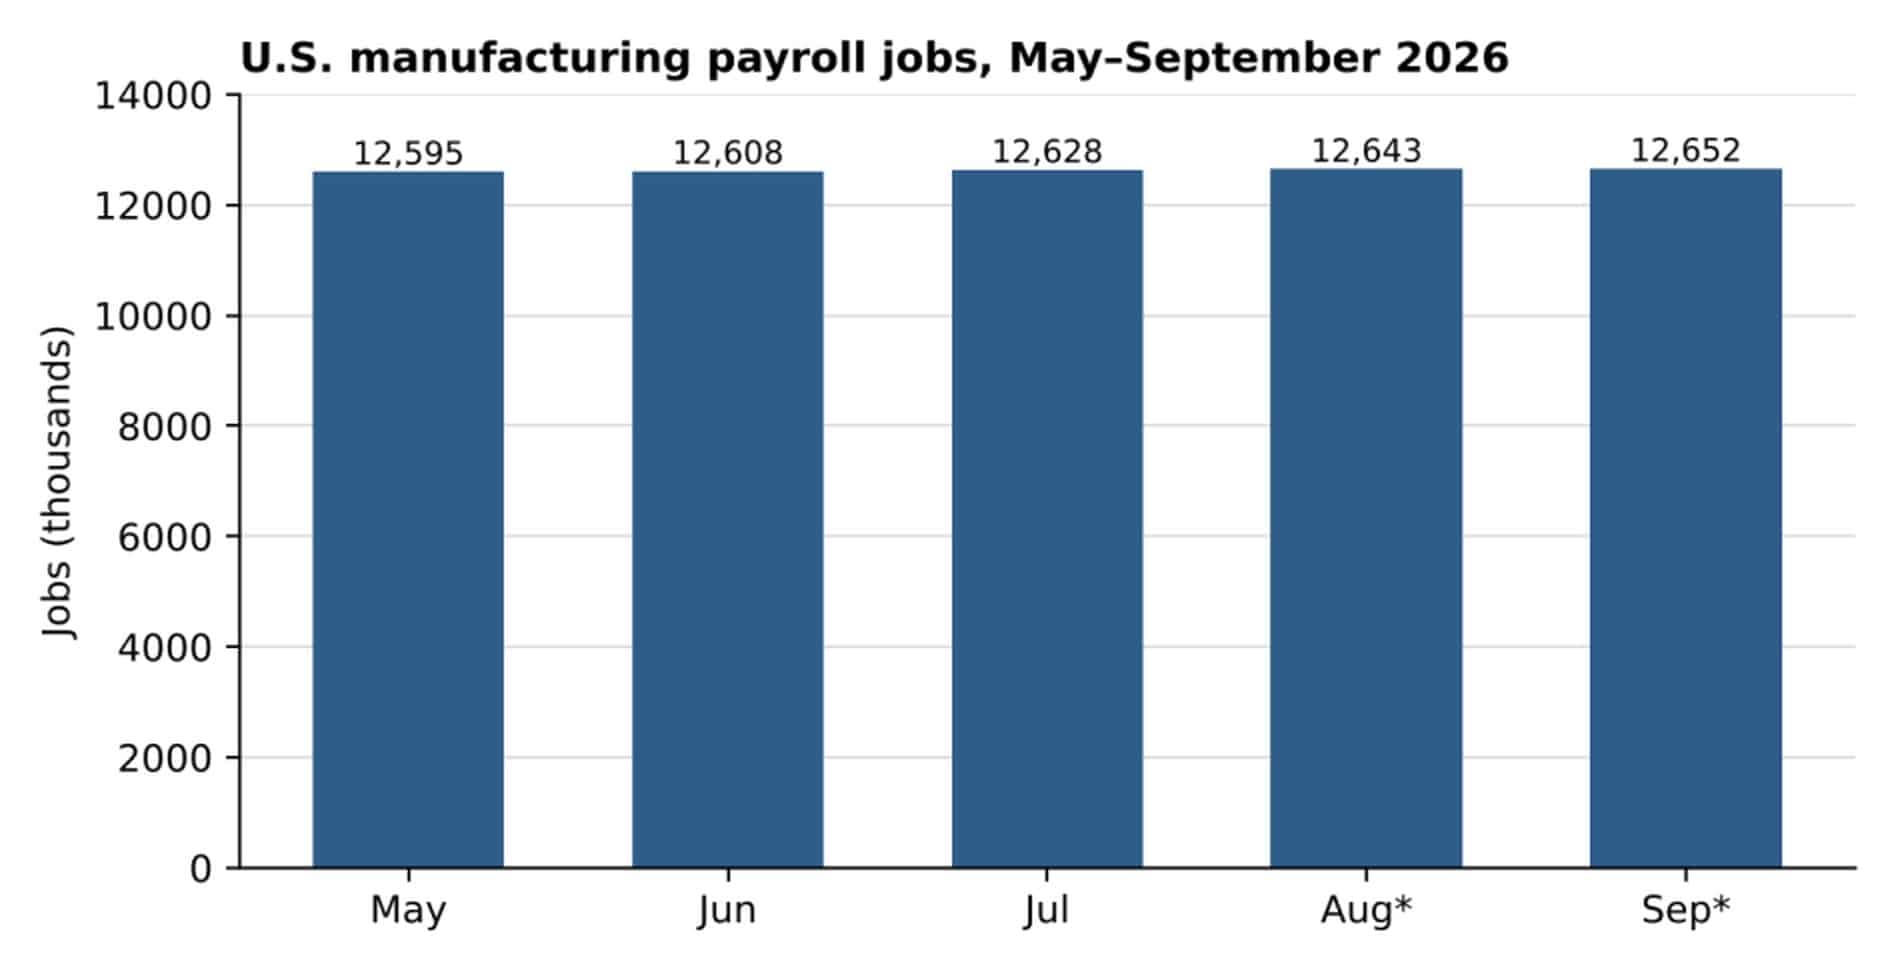
September added 9,000 jobs over August. Durable-goods manufacturing accounted for 8,000 of that increase and nondurable goods for 1,000. This short window shows a recent rise in payrolls, but it can’t establish a long-term growth rate or explain why employers added jobs.
An employment count also isn’t a count of open positions or a measure of how hard it is to hire. Plant staffing decisions still need local information on occupations, shifts, and skills, beyond a national payroll total.
Manufacturing Value Added by Goods Category: Second Quarter 2026
Durable and nondurable goods both contribute heavily to manufacturing value added. The two broad categories below give a same-period view of the industry’s economic mix, separate from its workforce total.
The U.S. Manufacturing Value-Added Mix, 2026
| Goods category | Value added, billions of dollars | Calculated share of manufacturing value added |
|---|---|---|
| Durable goods | $1,694.7 | 53.5% |
| Nondurable goods | $1,473.3 | 46.5% |
Dollar figures are current-dollar, seasonally adjusted annual rates for Q2 2026. We calculated each share by dividing the published category value by the $3,168.1 billion manufacturing total and multiplying by 100. The published category values sum to $3,168.0 billion, a $0.1 billion rounding difference from the reported total. Shares are rounded to one decimal place.
These are broad goods categories, not rankings of individual industries. A larger value-added share doesn’t necessarily mean more employees, more shipments, or a bigger warehouse footprint. Those comparisons need their own measures and matching definitions.
For an operations team, that distinction keeps an economic ranking from turning into an unsupported logistics assumption. The industry mix is useful background for planning, but product dimensions, handling requirements, inventory policy, and order patterns are still separate inputs to warehouse and fulfillment decisions.
Manufacturing Employment by State: August 2026
California had the largest manufacturing workforce, followed by Texas and Ohio. The table ranks the ten largest state manufacturing payrolls by job count, not by manufacturing’s share of each state’s economy.
The Largest State Manufacturing Workforces, 2026
| Rank | State | Manufacturing payroll jobs |
|---|---|---|
| 1 | California | 1,203,800 |
| 2 | Texas | 982,800 |
| 3 | Ohio | 688,300 |
| 4 | Michigan | 583,300 |
| 5 | Illinois | 571,400 |
| 6 | Pennsylvania | 557,300 |
| 7 | Indiana | 516,900 |
| 8 | Wisconsin | 458,400 |
| 9 | North Carolina | 450,000 |
| 10 | Florida | 429,100 |
Figures are seasonally adjusted estimates for August 2026. BLS publishes the data in thousands, and we multiplied by 1,000. We checked the ranking against all 50 states and the District of Columbia in the source table. The full state table is available from BLS.
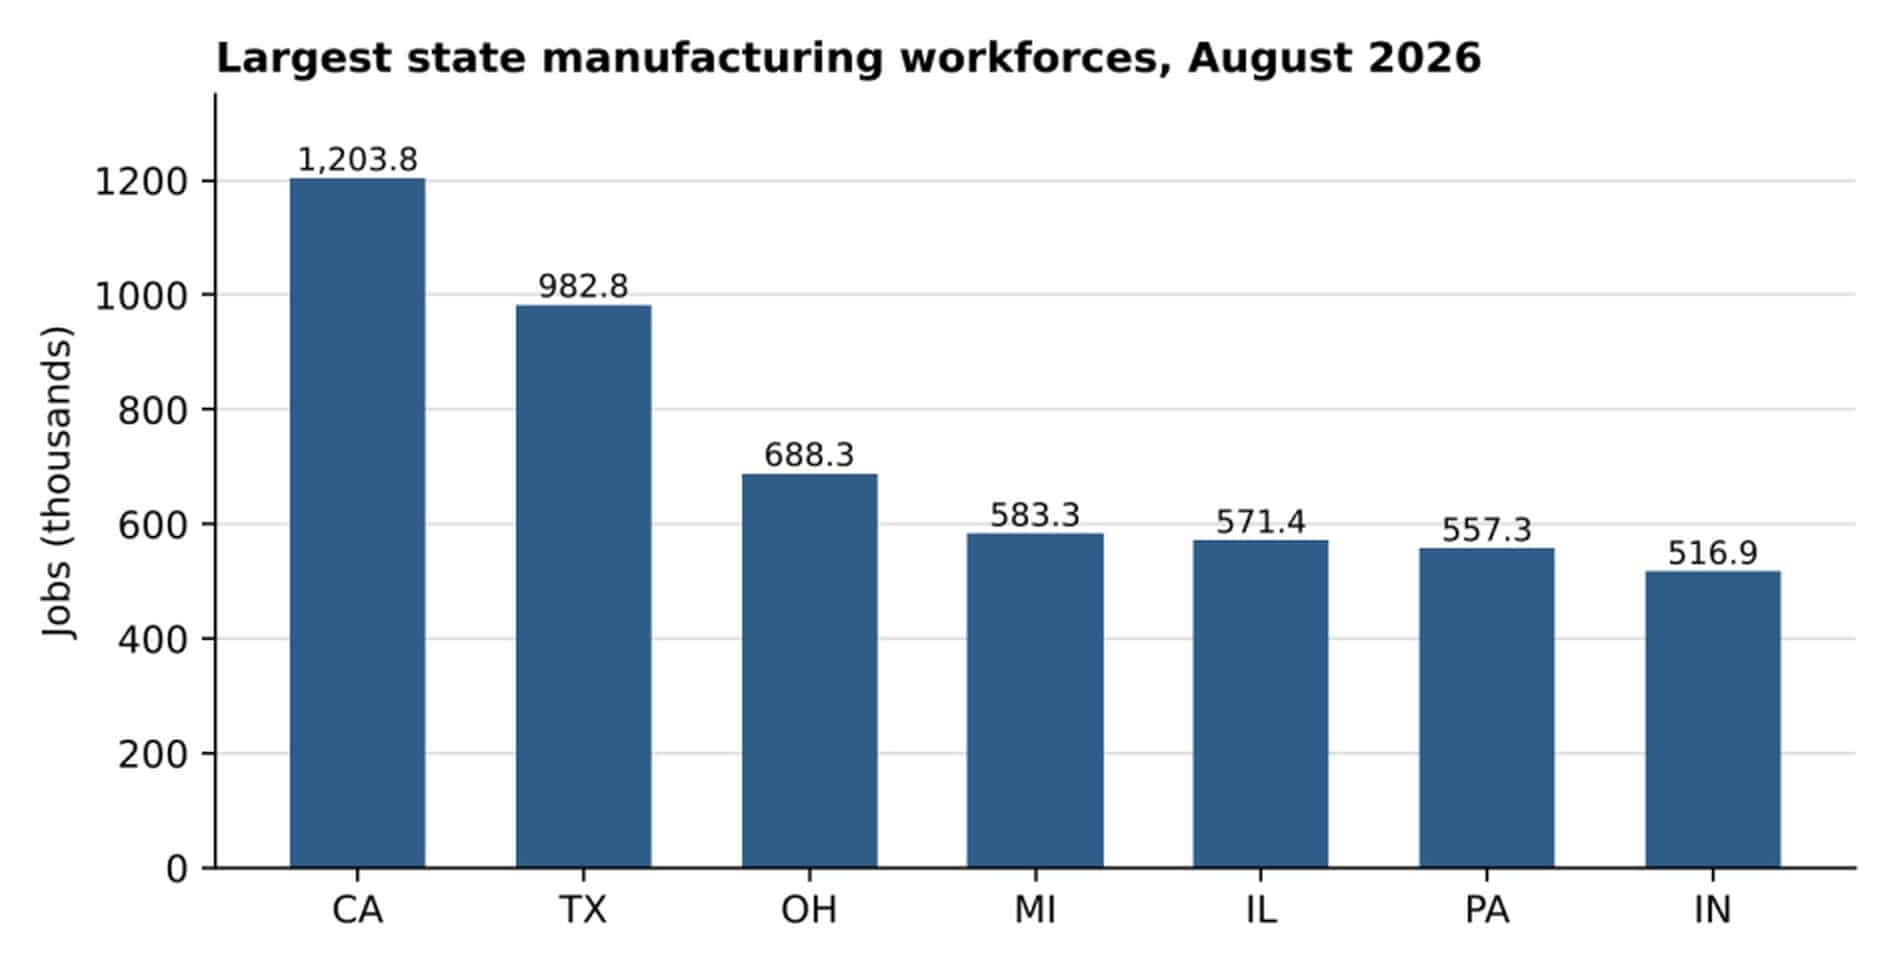
A state can have a large manufacturing workforce without being the most manufacturing-dependent state. Absolute employment counts and employment shares answer different questions. These figures also describe August, while the national headline describes September, so combining them into a September geographic breakdown would mix reporting periods.
For network planning, a statewide workforce is useful context. It doesn’t replace plant locations, customer destinations, lane volumes, or delivery requirements, and those operating details decide how relevant a location is to a particular manufacturing supply chain.
Manufacturing Capacity Utilization: March–August 2026
NAICS manufacturing capacity utilization reached 76.0% in June and July before easing to a preliminary 75.7% in August. The August reading was below the Federal Reserve’s published 1972–2025 average of 78.1% for the same NAICS manufacturing category.
The U.S. Manufacturing Capacity-Utilization Trend, 2026
| Month | Capacity utilization | Estimate status |
|---|---|---|
| March 2026 | 75.3% | Revised |
| April 2026 | 75.8% | Revised |
| May 2026 | 75.8% | Revised |
| June 2026 | 76.0% | Revised |
| July 2026 | 76.0% | Revised |
| August 2026 | 75.7% | Preliminary |
All observations are seasonally adjusted and use the Federal Reserve’s NAICS 31–33 manufacturing row. We kept the source table’s one-decimal precision rather than adding digits it doesn’t report.
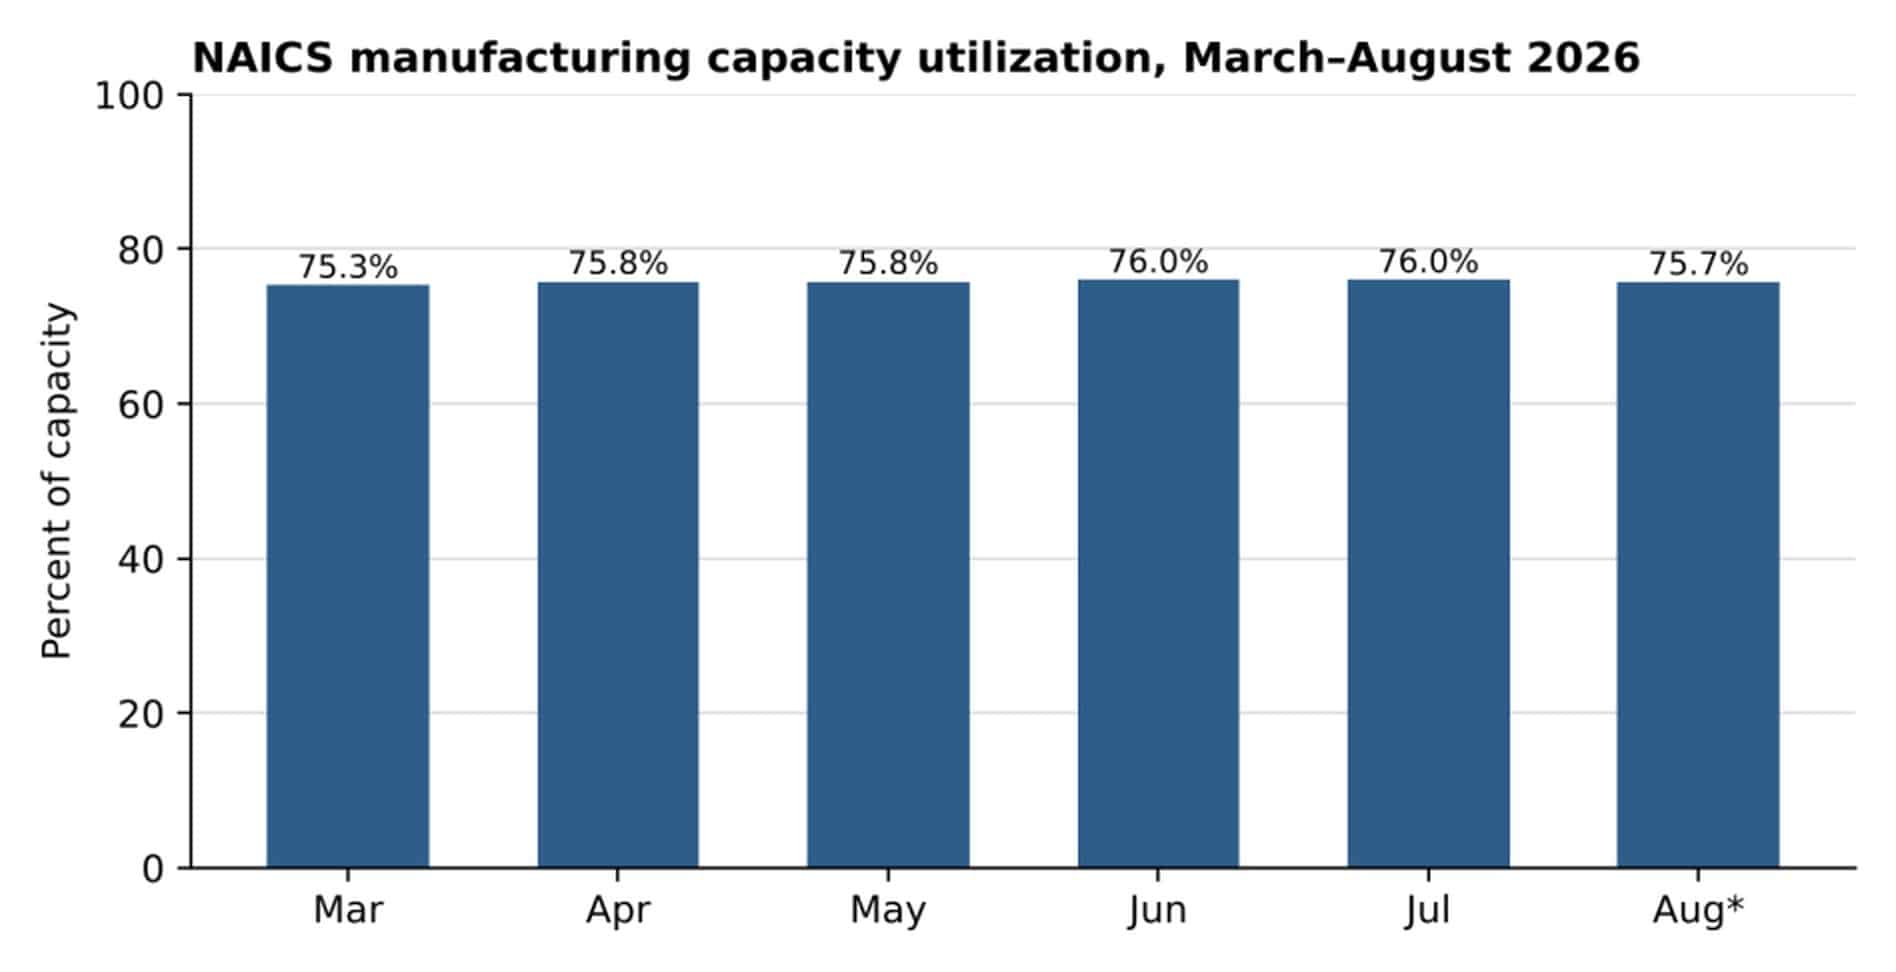
The national average doesn’t describe every manufacturing segment. In August, machinery utilization was 83.4%, while primary metals stood at 67.3%. Those readings come from different industries and shouldn’t be read as interchangeable measures of available capacity.
Capacity utilization doesn’t measure truck availability, warehouse occupancy, or an individual plant’s ability to take an order. It adds production context to the employment and economic indicators, but it says nothing about the condition of a manufacturer’s transportation network.
Request a PDF Copy
Want a copy of these manufacturing statistics? Request a PDF version of this report to keep these industry benchmarks and sources handy for future reference.
Sources
- MVP Logistics. Manufacturing Industry Statistics Research Compilation, October 2026. Original compilation and calculations presented in this article, based on the public sources below; not a separate study or primary survey.
- BEA via FRED: Manufacturing Value Added, VAMA. Q2 2026; updated September 30, 2026. https://fred.stlouisfed.org/series/VAMA
- BEA via FRED: Manufacturing Share of GDP, VAPGDPMA. Q2 2026; updated September 30, 2026. https://fred.stlouisfed.org/series/VAPGDPMA
- BLS: Employment Situation, Table B-1. September 2026; published October 2, 2026. https://www.bls.gov/news.release/archives/empsit_10022026.htm
- BLS via FRED: All Employees, Manufacturing, MANEMP. May–September 2026; updated October 2, 2026. https://fred.stlouisfed.org/series/MANEMP
- Census Bureau: Manufacturing Week Research Summary. Published September 28, 2026; includes 2024 AIES manufacturing revenue. https://www.census.gov/library/stories/2026/09/manufacturing-week.html
- Census Bureau via FRED: Manufactured Commodity Exports, EXPMANUS. August 2026; updated October 6, 2026. https://fred.stlouisfed.org/series/EXPMANUS
- BEA via FRED: Durable-Goods Manufacturing Value Added, VAMD. Q2 2026; updated September 30, 2026. https://fred.stlouisfed.org/series/VAMD
- BEA via FRED: Nondurable-Goods Manufacturing Value Added, VAMN. Q2 2026; updated September 30, 2026. https://fred.stlouisfed.org/series/VAMN
- BLS: Industry Employment by State. August 2026. https://www.bls.gov/sae/
- Federal Reserve: G.17, Table 7, Capacity Utilization. March–August 2026; released September 18, 2026. https://www.federalreserve.gov/releases/g17/20260918/